|
a free and open toolkit for 2d/3d seismic data analysis |
|
kogeo seismic toolkit |


|
Contact:
|
|
Phone (home): +49 - 40 - 2780 7890 Phone (office): +49 - 40 - 42838 5234 Fax: +49 - 40 - 42838 7081 E-Mail: konerding@geowiss.uni-hamburg.de |
|
Features |
|
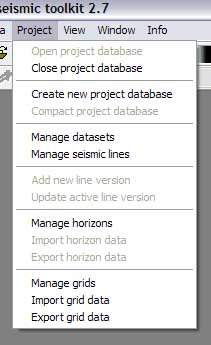
kogeo’s functions for project database management can be accessed from the ‘Project‘ menu:
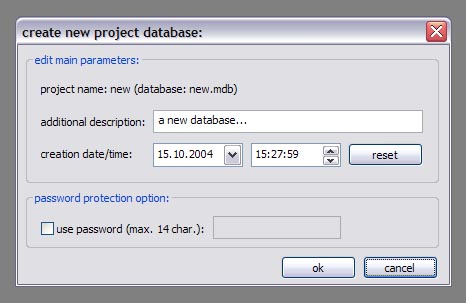
A project database is meant to be a container for informations around your seismic data (like navigation, horizons etc.), making them accessible as fast as possible. Additionally the map-view system in kogeo depends on project databases, a map-view is only available, when a project database is active. The databases themselves are of the MS-Jet ‘.mdb’ format, you can open and edit them for example with MS-Access. Dataset management: Before a project database can be used, it needs to be physically created, this means the table bodies and relationships are defined. To create a database, use the ‘Create new project database’ menu item, which will bring up the corresponding dialog window after you have chosen a name for the new project.
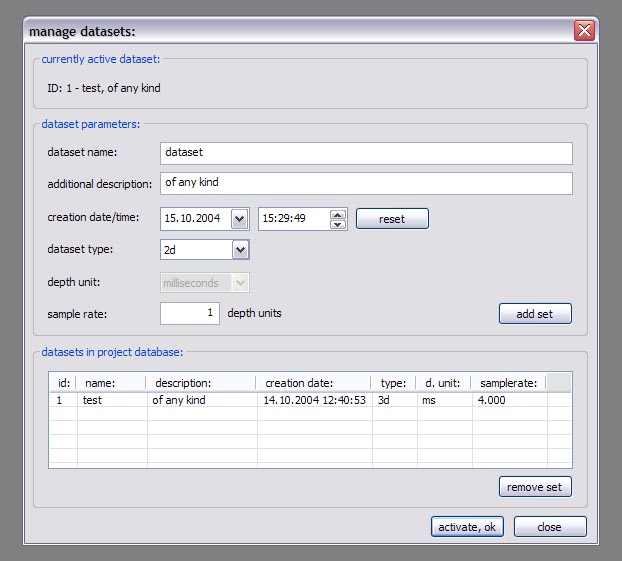
You can input some additional information about the new project and edit it’s date and time of creation - these fields are available for many database items; in fact they don’t mean too much. If you like to protect your database, you might specify a password, which needs to be entered when the database is opened later on. After the database is created you’re asked to create on or more ‘datasets’, in which the seismic lines are arranged. A project can contain several datasets, each of them might contain several 2d seismic lines or a single 3d seismic line. The data of one (active) dataset is displayed on the map-view in the end. If not directly after the database creation, the dataset management is accessible using the corresponding menu item/dialog window:
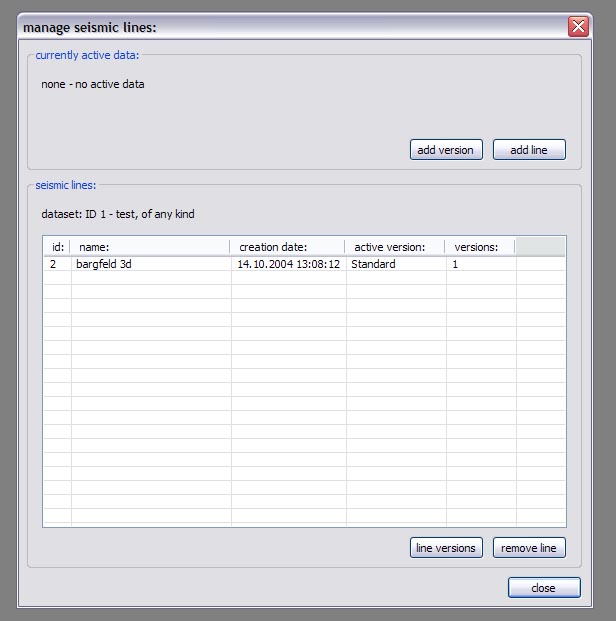
For each dataset you create, a name (+additional information and date), a type (2d or 3d) and a sample rate (all seismic lines in one dataset need to have the same) must be specified; the dataset itself is created with the ‘add set’ button. Afterwards it appears on the list in the lower part of the dialog window. A dataset can be deleted from the database by choosing it on the list and pushing the ‘remove set’ button; if a dataset is removed, all seismic data in it is deleted as well. To open a project database, choose the ‘Open project database’ menu item. If the selected database has the correct format, you’re prompted to pick a working dataset; in a newly created database it will be empty, of course. If everything is correct, the map-view window will appear indicating that kogeo is ready to work with the database. Seismic line management: A seismic line you want to be included in the active dataset needs to be imported first and it’s navigation needs to be specified; line navigation must be in decimal degrees for putting a line into a project dataset, so you’ll maybe have to transform your navigation first. The map-view can be displayed in projected coordinates later on, refer to the user interface section about this. If a line imported and the specified navigation matches the actual projection settings of the map-view, it is already displayed on the map (in orange, by default), but not selectable by clicking like the data that is in the active dataset (displayed in red). When line and navigation are properly set up, use the ‘Manage seismic lines’ menu item to open the line management dialog window:
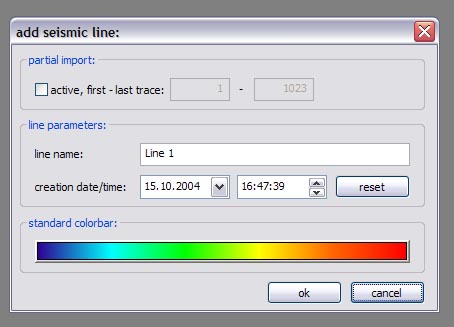
Press ‘add line’ to proceed to the ‘add seismic line’ dialog:
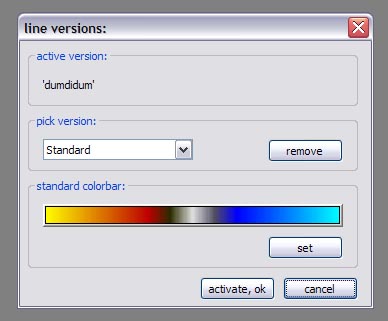
2d lines can be treated partially, when the corresponding option is activated in the upper part. Below specify a name and date plus a standard colorbar, which is used when the data is displayed later on. Pressing ‘ok’ finally starts the import process. If everything works out, you’ll find the new line on the list and you might leave the line manager. Every seismic line might exist in several versions in a dataset (for example the results of different processing steps); the original version is always called ‘Standard’ and can not be changed or deleted, only if the seismic line as a whole is removed from the database (by clicking the ‘remove line’ button of the line management dialog). To access the line version management, select the line on the list and click the ‘line versions’ button.
In the ‘line versions’ dialog you can remove versions (except from ‘Standard’) or change their standard colors. The ‘activate, ok’ button closes this dialog and sets the selected version active, which means that it will be used as the default version, when the line is displayed. The active versions are indicated in the line management list. Adding a new line version can be done in two ways. First, you can import a new line version from an external file (must have the same size in samples and traces like the original) and use the ‘add version’ button in the ‘manage seismic lines’ dialog, or you edit your data in kogeo and use the ‘Add new line version’ menu item. Both methods will bring up the ‘add new line version’ dialog window:
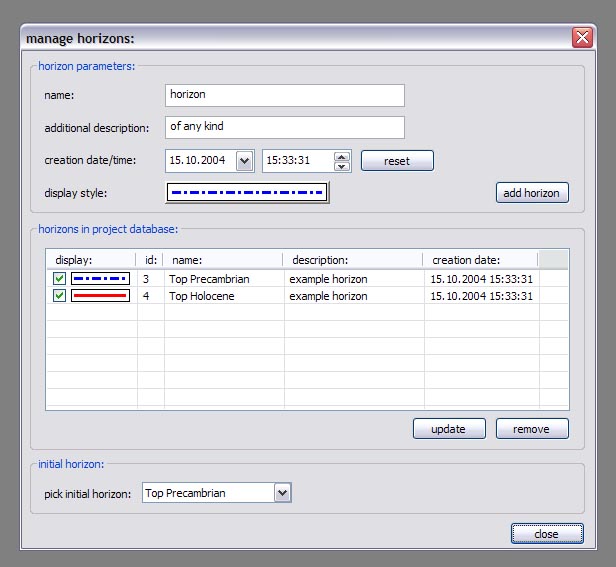
Specify name, creation date and standard colors for the new version and confirm the settings by clicking ‘ok’. If you have edited a version other than ‘Standard’, you might also choose the ‘Update active line version’ menu item, to store the new data under the old version entry in the database. Horizon management: Horizons can be created, removed and edited in the ‘manage horizons’ dialog, opened by the corresponding menu item:
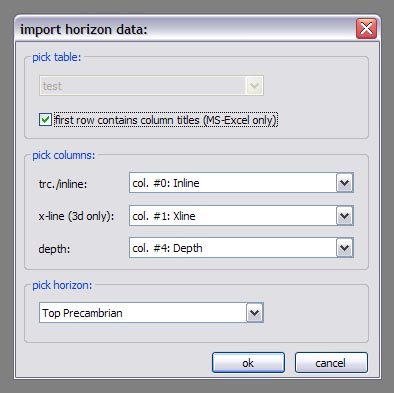
Setup a name and display style for a new horizon (plus description and date, of course) and press ‘add horizon’ to add it to the list. Horizons are not bound to a specific dataset, they’re accessible throughout the entire project. When you select an horizon on the list, you can remove it from the project or update it’s appearance or name (change the re-called settings in the upper part of the dialog). If you uncheck the display option on the list, the respective horizon will not be displayed and can not be edited on data-views. Since the database updates during horizon editing might be time consuming, this can be pretty practical. The ‘initial horizon’ you can choose in the lower part of the dialog window, is the one that will be active for editing when you leave the horizon manager. See the user interface section for more information about how the horizon editing mode is activated and so on. Horizon picks can be imported into a kogeo database by using the ‘import horizon data’ menu item. After you have chosen an import source file, set up the import table definition in the ‘import horizon data’ dialog:
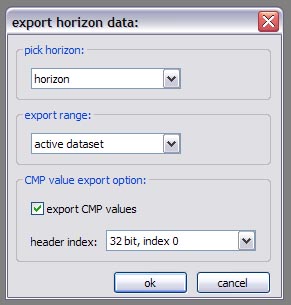
Depending on the import source, you might have to pick a table or check the ‘first line contains column titles’ option. In the middle part specify the columns to retrieve data from and choose an horizon to add the data to. The horizon needs to be created before if it doesn’t exist already. Existing picks will be overwritten during the horizon import from file. The horizon import function makes a lot of sense if you want to display horizon slices (e.g. to check a dip/azimuth dataset; see the user interface section), since up to now there isn’t any autopicking functionality in kogeo. Horizon picks can be exported to a file as well, use the ‘Export horizon data’ menu item to do so. After specifying a file name, choose an horizon to export and an ‘export range’ in the corresponding dialog window:
The ‘export range’ can be set to ‘active data’, active dataset’ or ‘entire project’ and will restrict the export of horizon picks to the according range. If you want to, you can activate the additional export of values read from the trace headers to have a link to the original data files. Grid management: Use ‘Project->Grid management’ to open the grid management dialog:
Enter a name, description, date and set up a standard colorbar (for display) for a new grid to be created; existing grids are displayed in the lower part of the dialog window, they can be deleted using the ‘remove’ button, their properties can be edited using the ‘update’ button. Press ‘create grid’ to bring up the ‘create grid’ dialog:
Choose a horizon as input data; activate ‘attribute grid’ if you want to create a grid from amplitudes (or attributes: frequencies, envelope or what ever) instead of horizon z-values. Enter the horizontal/vertical number of grid nodes, minimum coordinates and node-to-node widths; the two latter parameters can be set automatically from the input data using the ‘from data’ and ‘autoset’ buttons. Choose one of the following gridding algorithms: · Inverse distance squared · Simple kriging · Ordinary kriging The required parameters need to be set in the lower part of the dialog window. All algorithms require a search ellipsoid definition:
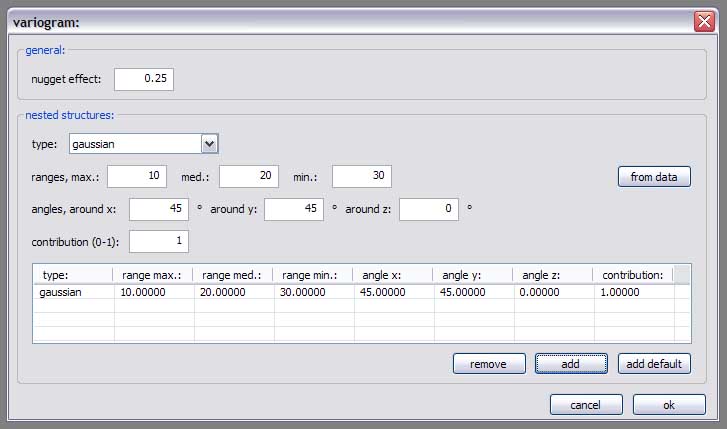
The max. number of conditioning data gives the number of input data points used to calculate each grid node (or activate ‘all data’ to exclude none). Ellipsoid dimensions and rotation angles need to be given in 3d, even though z-parameters are ignored in 2d gridding. If you want to use simple or ordinary kriging a variogram definition is also required:
Variogram definitions may contain various nested structures to account for the spatial anisotropy of the input data. To read about displaying grids in the map-view of a project dataset, please refer to the ‘user interface’ section. |


Read more about... |
|
...project databases and interpretation
|
|
You‘re visitor no.: |
|
Home |
|
About kogeo |
|
Features |
|
Download |
|
Building instructions |
|
Guestbook |
|
Home |
|
About kogeo |
|
Features |
|
Download |
|
Building instructions |
|
Guestbook |